.avif)
Early data modeling at Pelanor


TL;DR
Pelanor is reimagining cloud cost management with AI-native FinOps tools that explain spending, not just track it. By rebuilding the data layer from scratch, we deliver true unit economics across complex multi-tenant environments - revealing what each customer, product, or team actually costs. Our AI vision is deeper: we're building systems that truly reason about infrastructure, learning what's normal for your environment and understanding why costs change, not just when.
When we established the engineering group at Pelanor, we had little doubt that traditional cost management approaches were lagging far behind modern cloud architectures. You’ve probably heard this before; existing solutions tend to be either infrastructure-centric or target specific stacks (like Kubernetes). Neither bridges the gap between the low level building blocks of cloud environment and the high level business context, and thus cannot meaningfully address the most useful questions, those of the form “how should I use my engineering and DevOps resources to get the most bang for the buck?”. But at least you could see the total cost of EC2 instances with some tag.
Like most software engineers we’re an optimistic bunch, and we originally perceived this as “yet another Excel-class SaaS situation”; we’ll need to pull the right data, run a few clever analyses, and plug it into whatever the frontend ecosystem collectively decided is the Data Visualization Framework of This Week. The real challenge surely would be on the product’s team doorstep, helping users make sense of it all.
But this naivete faded away as we became intimately familiar with cloud vendors’ billing data exports. We lost count of the internal contradictions and backwards-compatibility chaos, but it only strengthened our resolve to develop a data model that makes it possible to fluently reason about cloud costs.
This is the tale of the rocky road to that model.
Our first iteration was based on a hard distinction between “billed resources” and “logical resources”. Billed resources represent the world as the CSP perceives it: VMs, block storage volumes, object storage buckets, managed relational databases, etc. Each resource could be mapped cleanly to one or more underlying billing records. Then, by leveraging many overlapping data sources - metadata from the CSP, eBPF sensors, logs, 3rd party SaaS integrations - we could progressively introduce logical resources. They can represent a container running on a VM, a partition on block storage, a set of prefixed objects in a storage bucket, a table in a relational database. We envisioned they could represent increasingly granular and abstract concepts, such as an individual query running on a database, events in a message queue or even pull requests or an organization’s end-users.
These logical resources alone are not useful. But by linking them to the underlying billing resources, we could compute their proportional cost. The edge linking the container and its VM will specify the compute resources consumed by that VM; CPU core-hours, memory, storage, and network. Similarly, the edge between a query and the database will specify the total runtime and IO consumed by the query.
So we’re talking about a directed graph. Here’s a visualization from an early prototype (dated December 14th, 2022, two weeks before the company was formally founded):
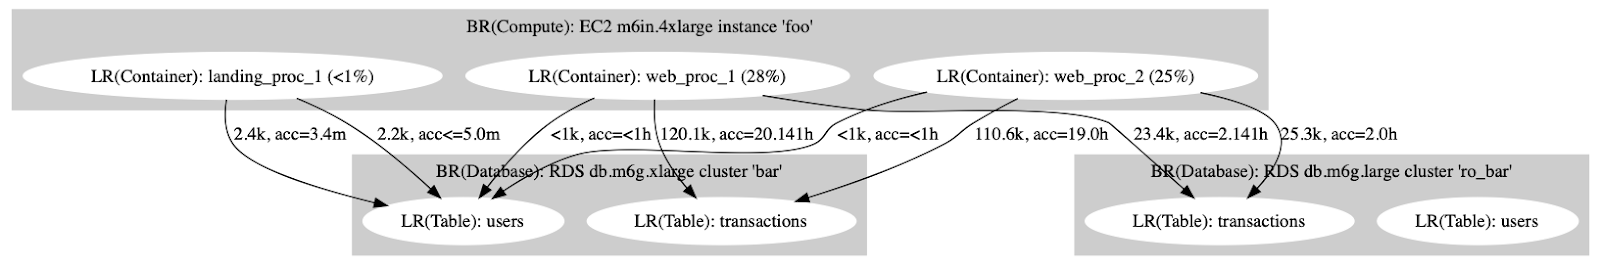
(Of course, much of the data we’d need to build this graph is not readily available, especially where low-overhead instrumentation is required - for example, observing what queries and storage accesses a pod makes. But we’ll talk about these challenges elsewhere)
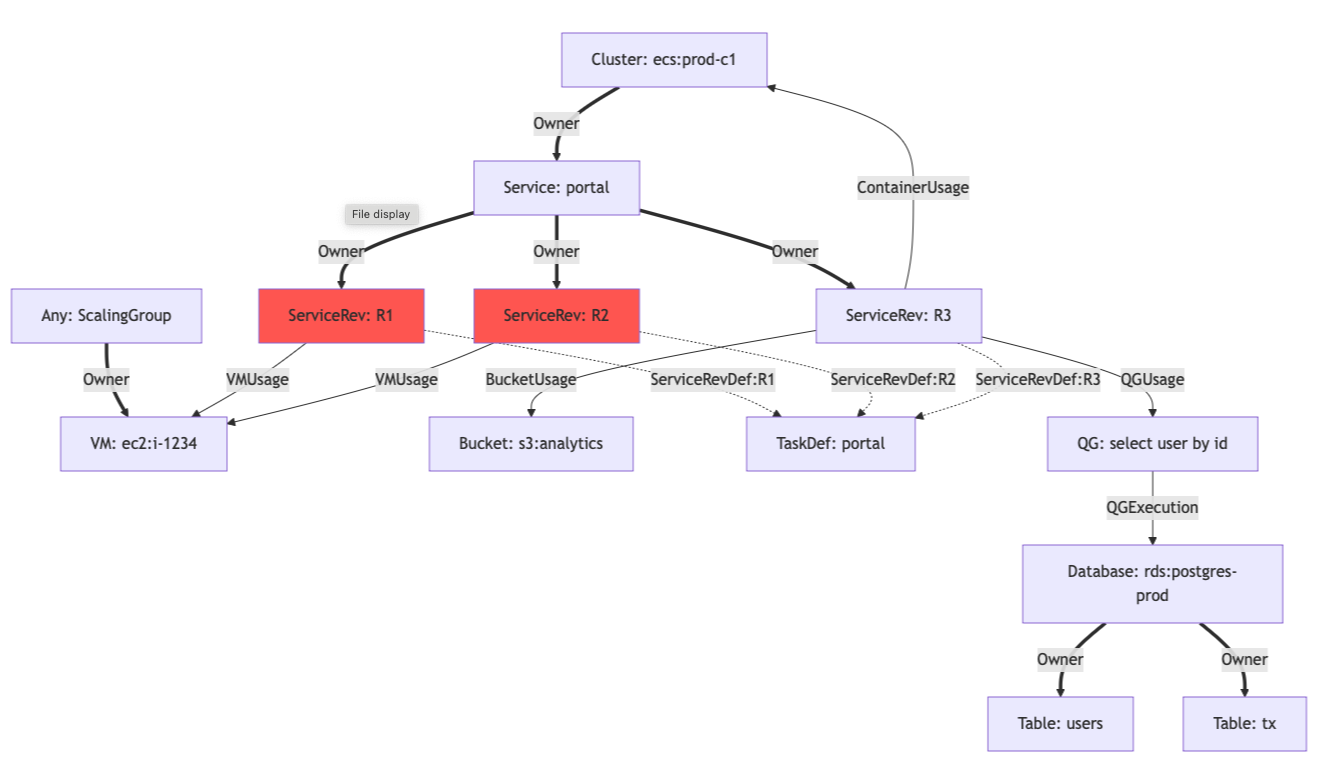
Assuming we can search for nodes in this graph - by type, name, tag, region, service name, table name or any other property, it’s easy to imagine how we could elegantly and efficiently compute the proportional cost of any logical resource or combination thereof. It would be cheap to store and easy to parallelize, at the very least for each weakly connected component. We’ll even be able to ask questions like “what PR is associated with the cost change in this resource?”. All that’s left is to come up with a fancy marketing name for what is essentially postorder DFS and to make sure we don’t insert any cycles.
But its elegance is strictly limited to paper and graphviz plots. In reality, it suffers from inconsistent and overly-coarse representations in the billing data (such as billing records relating “total cost of logs in region X and account Y” instead of being attached to a concrete resource). It also suffers from versioning: when a resource is updated, its dependent resources might also be duplicated, which can produce a large cascading effect. For example, when an ECS service is updated - or even just rescaled - multiple elements representing its underlying tasks, containers and even individual processes could be inserted, and outgoing edges to shared resources (databases, object storage, message queues) will multiply as well.
Oh, and it does suffer from cycles after all, which are unavoidable in a world of microservices.
But above all, it suffers from assuming low-latency access to two vastly different modalities - graph relations between resources, and temporal metric data. We were confident we could solve the other challenges, but we’d still need something to let us insert and query all these nodes, edges, and metric data.
We were impressed by some of the modern timeseries databases on the shelf at the time (and rather unimpressed by the graph databases we saw), but no one seemed to be building a database that does both. To be clear, we’re not complaining. In fact we doubt such a general purpose database is plausible; there are too many degrees of freedom in our approach. But we started to envision a reasonably simple purpose-built database that did these traversals well. There was a lot of healthy skepticism during these few days; while many of us come from fairly low-level backgrounds, we all respected database engineering as a craft unto itself.
As a kid I’d frequently go to my dad for programming advice. I distinctly remember one afternoon in 2011 in which I was struggling to work out a data model for a messaging app I was building for school. This was the height of the NoSQL “web-scale” craze, so I couldn’t imagine doing the reasonable thing (using a relational database). My dad advised me to consider MySQL, and when I told him I was concerned it wouldn’t scale he said - “if that ever happens, call me”. Over the years I ended up drifting towards the SQL-free world of compiler engineering, so it felt great to have come full circle on that day.
In the next post, we’ll look into lessons we learned while building early versions of Pelanor’s homegrown graph/timeseries hybrid database.