.avif)


R


Full transparency into how we collect and analyze data. Accountability that transforms teams conversations
Non-disruptive implementation with progressive rollout - start small, expand with results
Day-one usage-based savings and accelerated root-cause analysis from deployment start

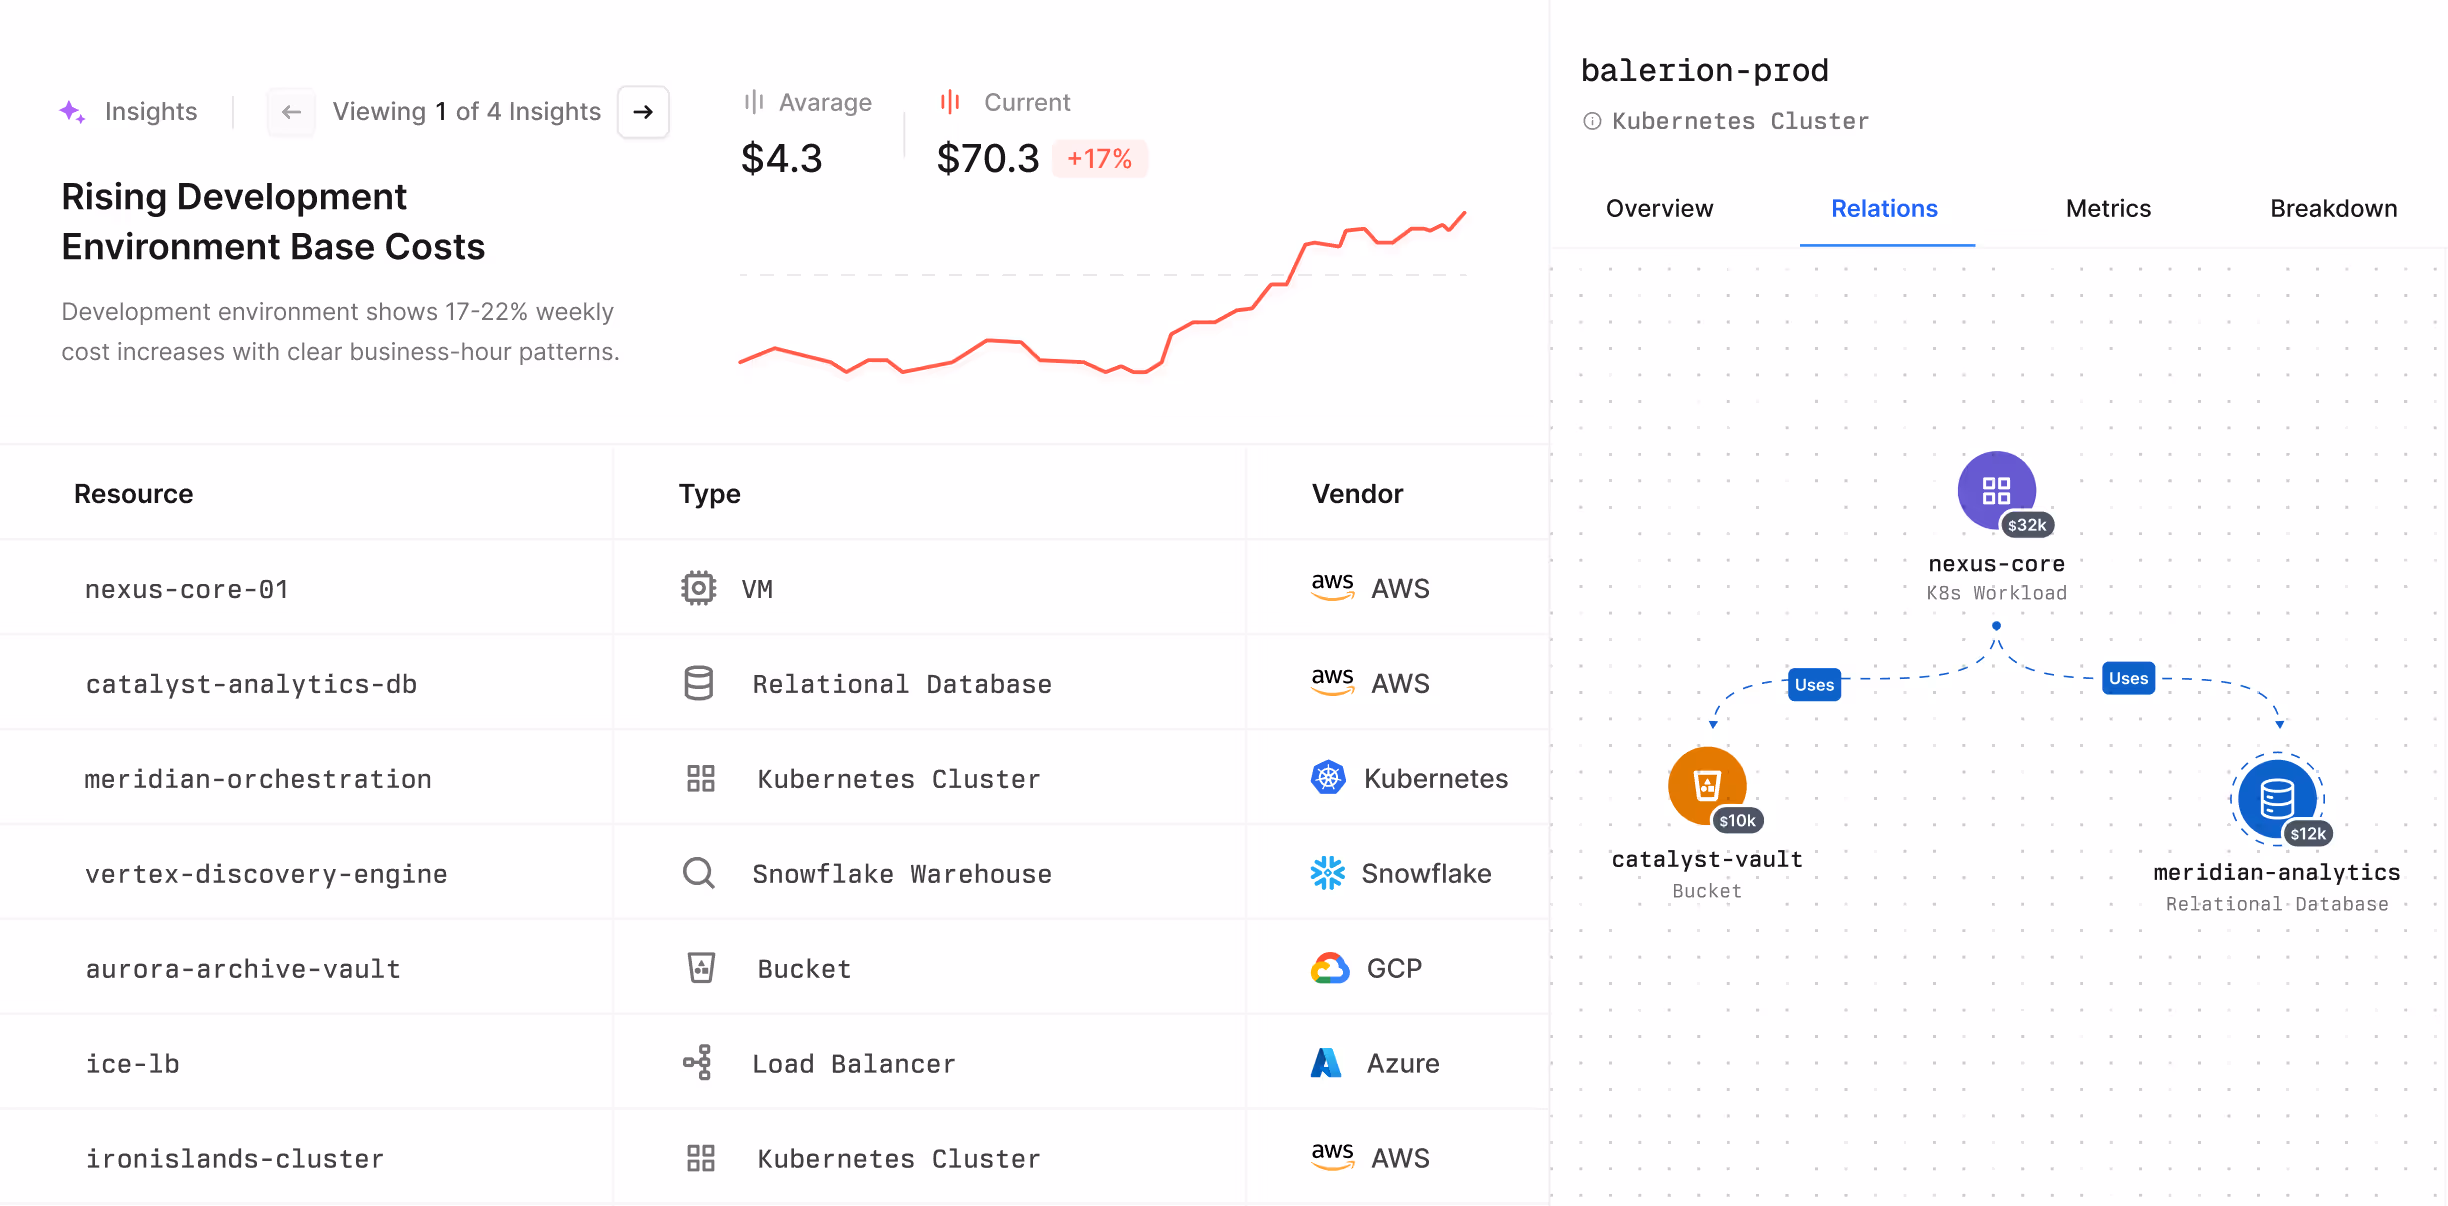
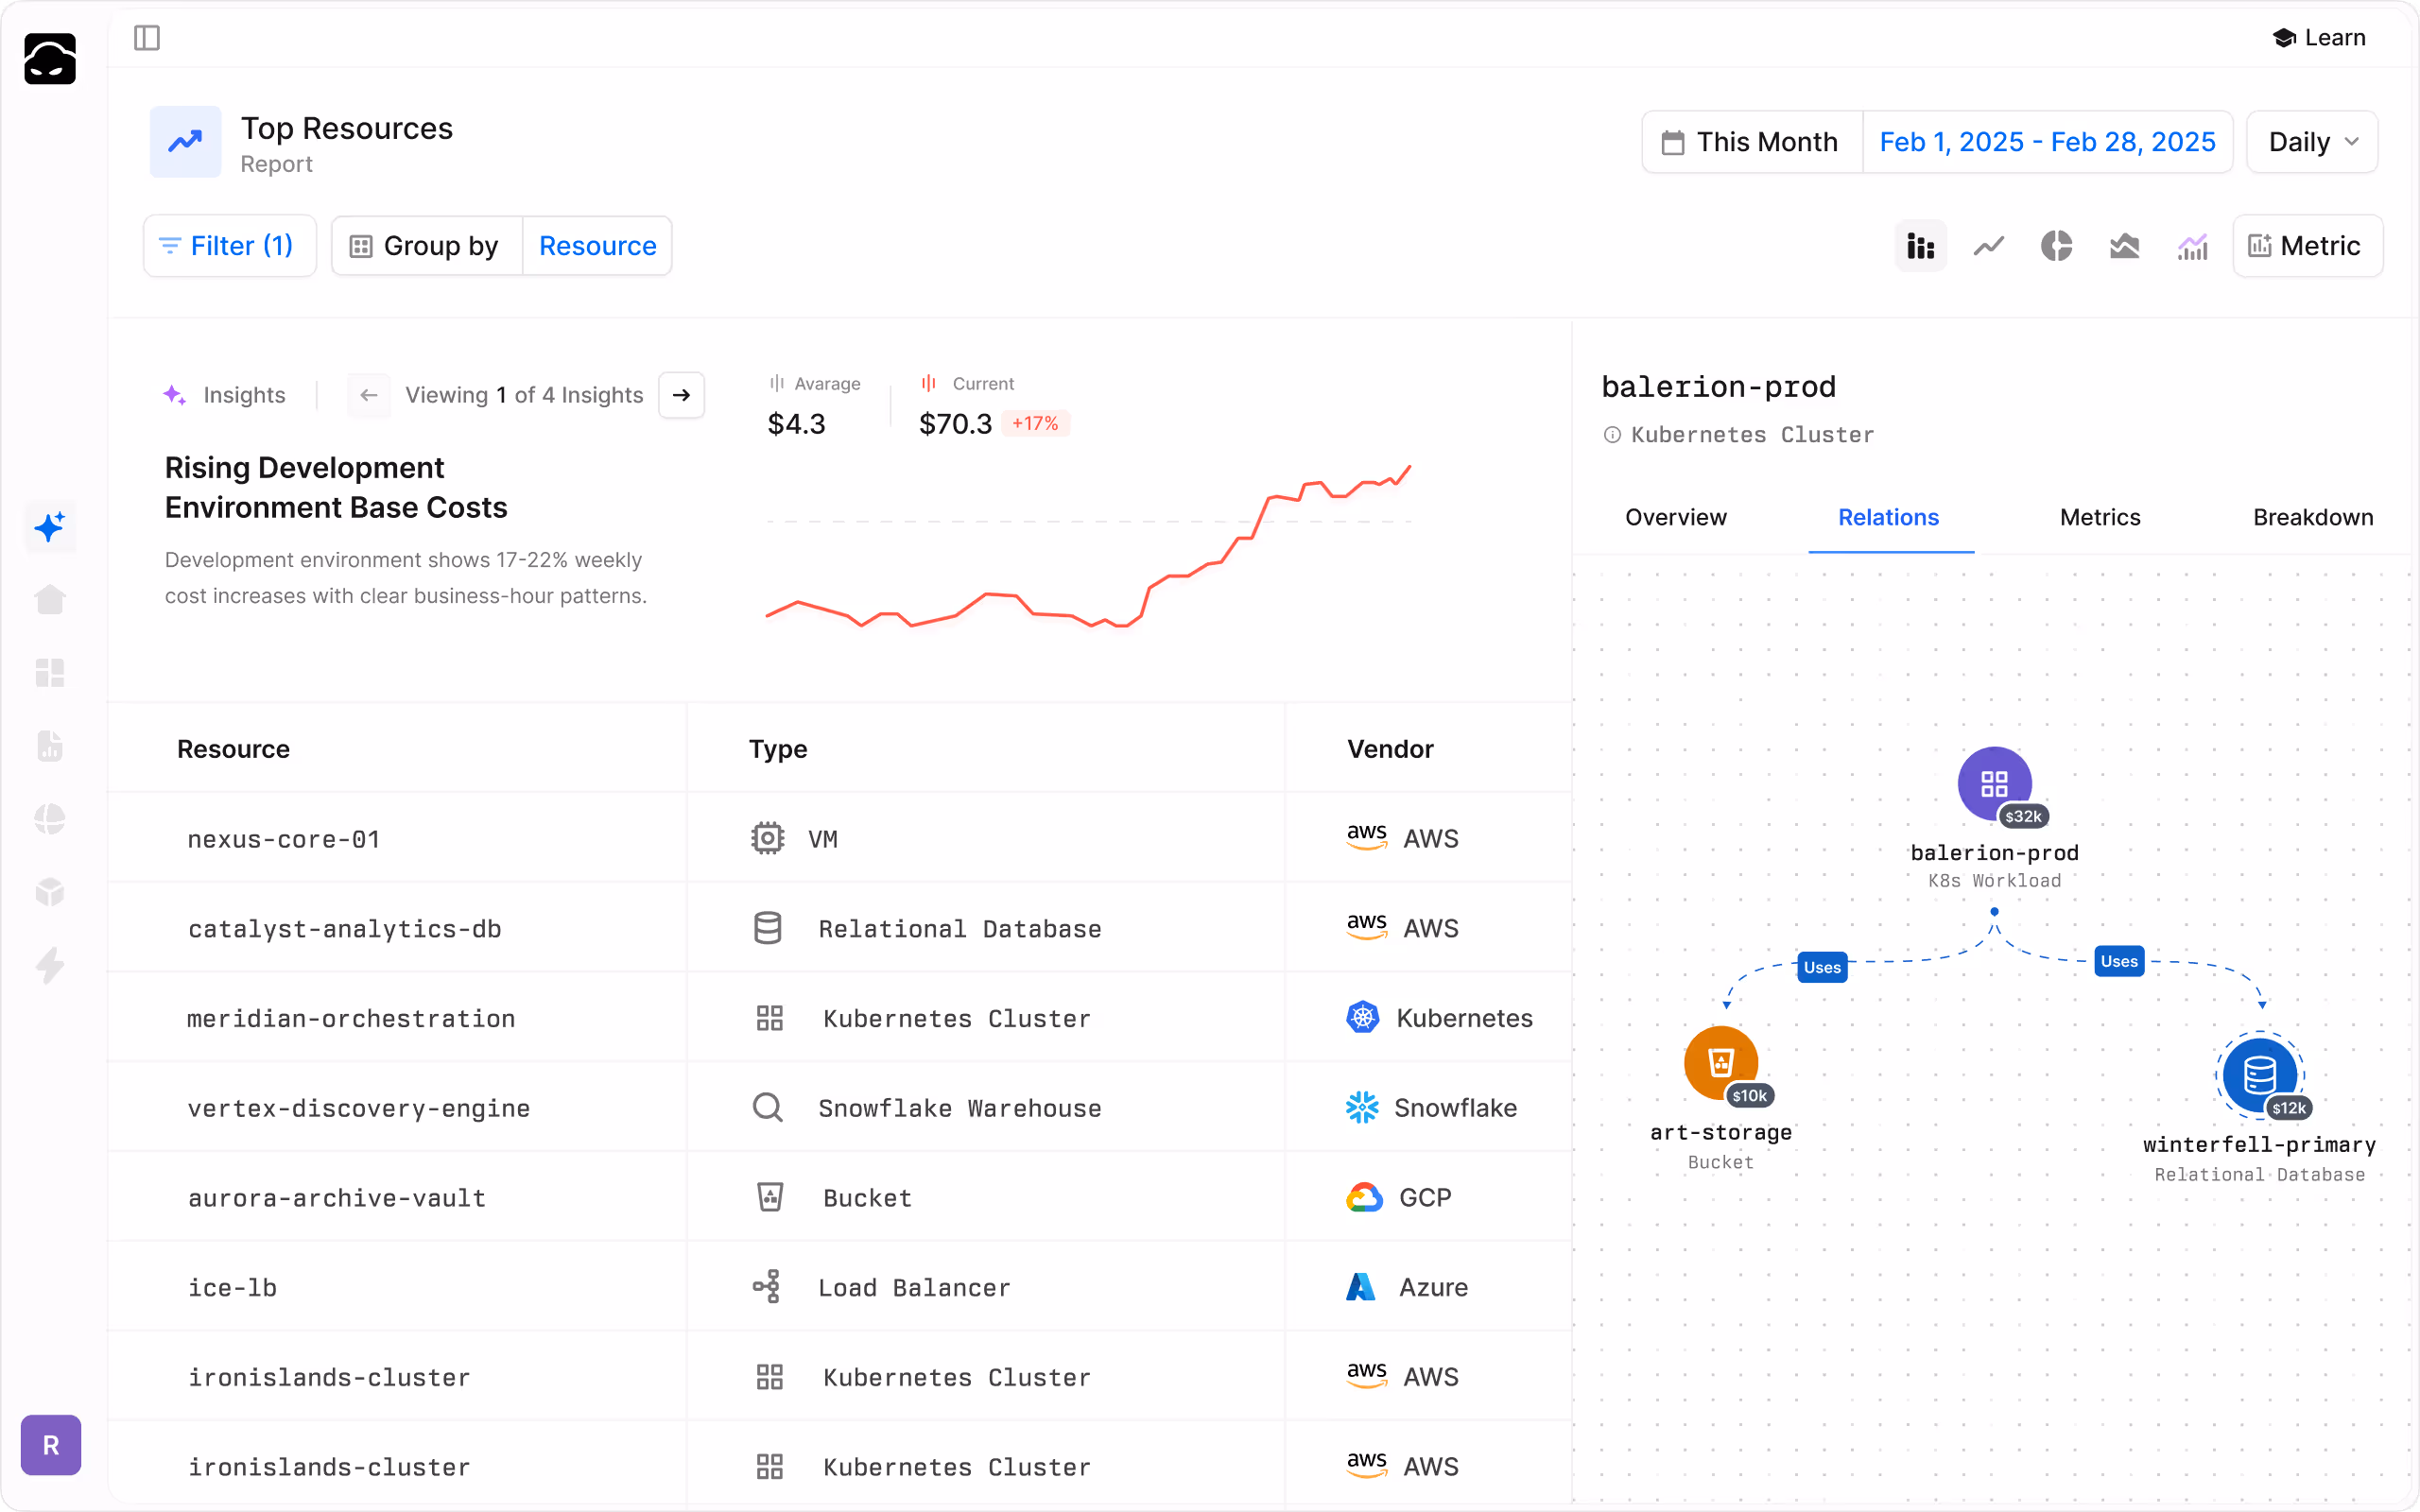
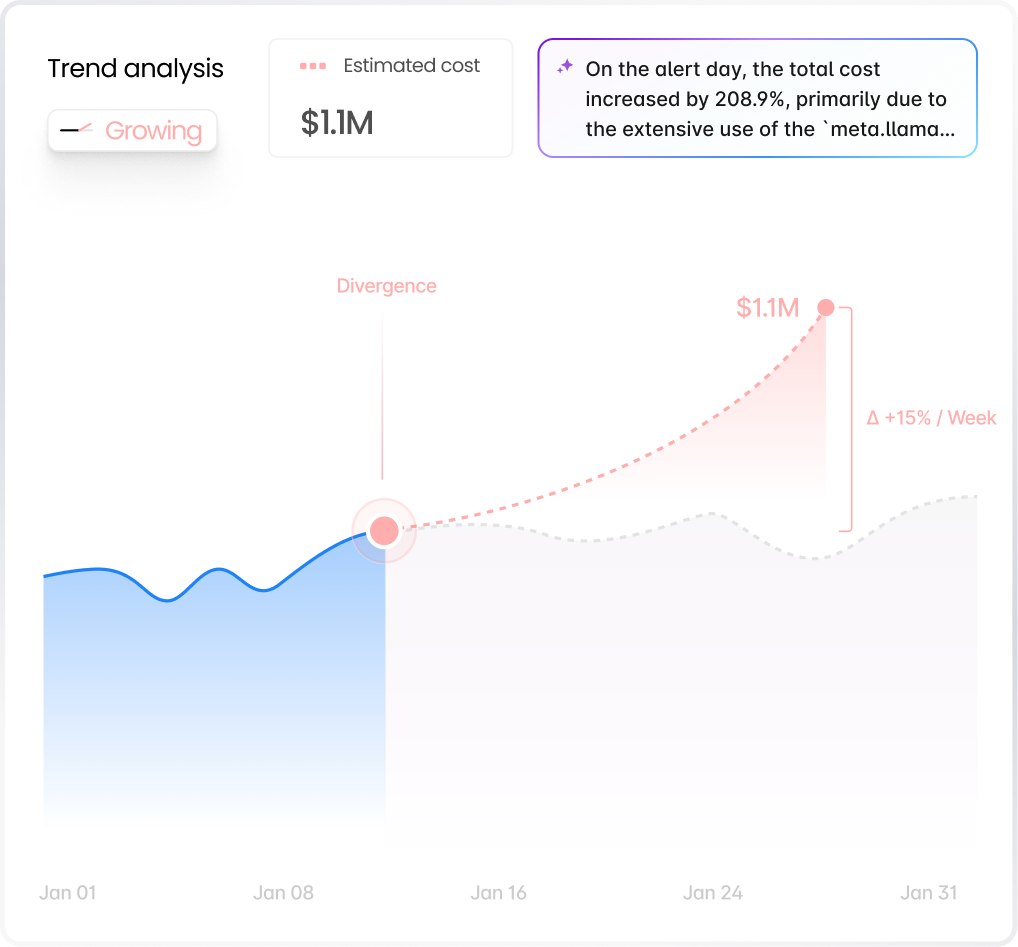
Pelanor's AI quickly identifies cost anomalies in your cloud and provides clear insights into the root cause.

Our model evolved through mistakes, insights, and necessity. Read how we moved from monthly bill shock to real-time clarity
See how Pelanor’s AI-first approach powers smarter cloud cost governance and and real-time automation
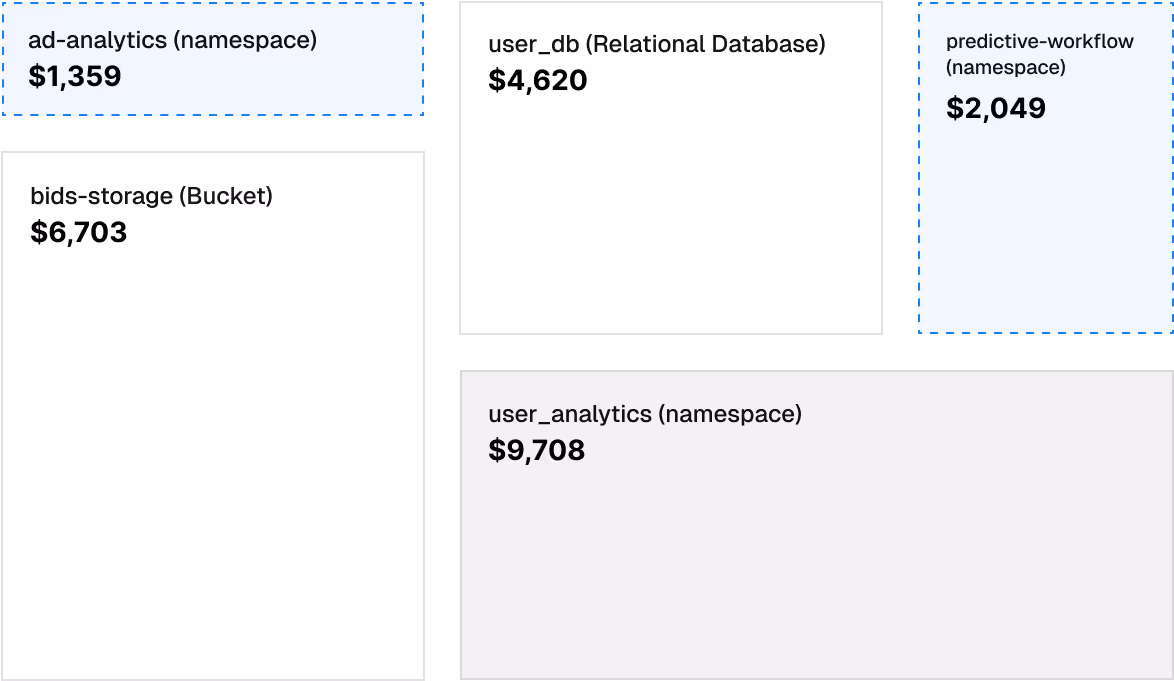
A graph-based framework connecting cloud infrastructure, billing data, and usage metrics for cost modeling